About
- Home
- About
Definition of Graph Analytics
Graph Analytics is a data analysis method that utilizes graph structures to understand and explore relationships between entities. In this context, data is represented as nodes that represent entities, and edges that indicate interactions or connections between those entities. For example, in a social network, nodes can represent users, while edges can indicate interactions such as 'friends' or 'followers'.
- Social Network Analysis
- Product Recommendations
- Fraud Detection
- Supply Chain Analysis
Key Components in Graph Analytics
Nodes
Nodes are the basic elements in a graph that represent entities. For example, in an e-commerce application, nodes can be products, users, or product categories. Each node can have additional attributes, such as name, price, or description.
Edges
Edges connect the nodes in the graph and indicate interactions between them. For example, in a social network, edges can indicate that two users are friends, or in a recommendation system, edges can show that two products are often purchased together. Edges can also have attributes, such as weights that indicate the strength or frequency of the interaction.
Attributes
Nodes and edges can have additional attributes that provide further information, such as username, product type, or edge weight.
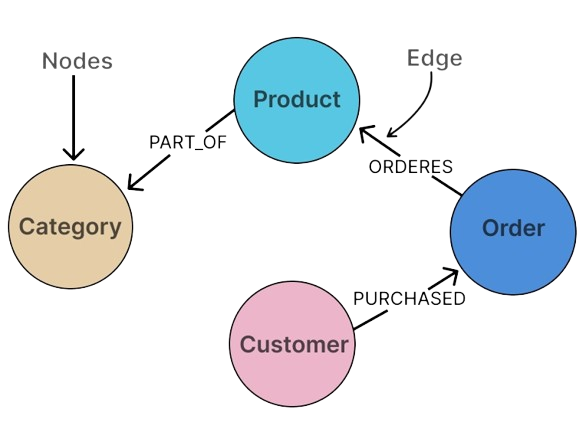
Graph structure showing nodes (circles), edges (lines)
Importance of Graph Analytics
Complexity Analysis
With the ability to handle unstructured data and complex relationships, Graph Analytics enables deeper analysis compared to traditional methods. For example, in social network analysis, we can identify interaction patterns that are not clearly visible.
Better Decision Making
By understanding the relationships between entities, organizations can make faster and more accurate decisions. For example, in marketing, companies can tailor their strategies based on the connections and behaviors of their customers, leading to more effective campaigns.
Comparison with Traditional Data Analysis Methods
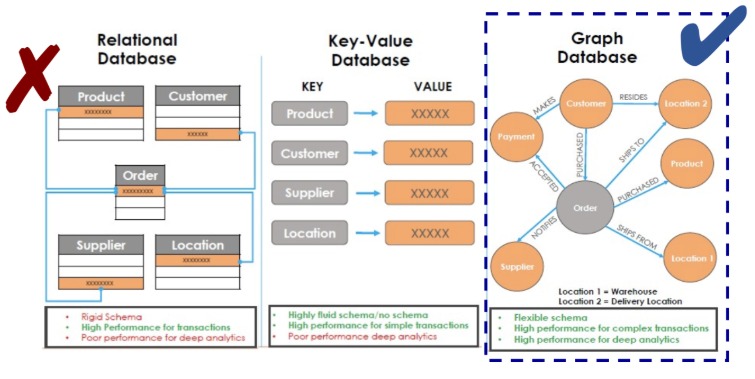
Relational Database vs. Graph Database
Relational Database
Stores data in separate tables, where each table has a rigid schema. Relationships between tables are typically managed through foreign keys, which can make queries complex and slow when dealing with interconnected data.
Graph Database
Stores data in the form of graphs, where nodes and edges can be easily connected. This allows for more flexible and complex relationships, and makes data exploration easier. Graph Databases are more efficient in handling interconnected data, so queries involving many relationships can be performed faster.
Advantages of Graph Analytics
Deeper Relationship Analysis
Graph Analytics enables deeper analysis of relationships between entities. For example, in social network analysis, we can easily identify patterns of interaction and influence between users.
Better Performance for Connected Data
Graph Databases are designed to optimize queries involving relationships, so they can provide better performance compared to relational databases when dealing with interconnected data.
Flexibility in Data Structure
Graph Databases do not require a rigid schema, making it easier to add or change data structures without affecting the entire system. This is very useful in dynamic environments where data changes frequently.
Ability to Handle Unstructured Data
Graph Analytics can easily handle unstructured data, such as text or social media, by linking it into a graph. This allows for more comprehensive and holistic analysis.
Use Case
Social Network Analysis
In platforms like Facebook or Twitter, Graph Analytics is used to identify users with significant influence (influencers) based on their interactions and connections with other users.
Product Recommendations
E-commerce platforms like Amazon use Graph Analytics to analyze purchasing patterns and provide relevant product recommendations to customers, enhancing the shopping experience and sales.
Supply Chain Analysis
Companies can use Graph Analytics to understand the relationships between suppliers, manufacturers, and distributors, thereby optimizing the supply chain and reducing costs.
Graph Analytics Details
Graph Database Definition
A Graph Database is a type of database management system designed to store, manage, and manipulate data structured in the form of a graph. In a Graph Database, data is stored as nodes and edges that connect those nodes. This allows for a more natural and efficient representation of interconnected data.
Differences between Graph Database and Relational Database
Data Structure
Performance
Scalability
Advantages and Disadvantages of Graph Databases
Advantages
- Ability to handle highly connected and complex data.
- Better performance in queries involving relationships between entities.
- Flexibility in adding or changing data structures without requiring complex migrations.
Disadvantages
- May be less suitable for applications that do not require complex relationship analysis.
- Lack of support for some features common in relational databases, such as ACID (Atomicity, Consistency, Isolation, Durability) transactions in some implementations.
Graph Data Science Definition
Graph Data Science is a branch of data science that focuses on the application of analysis techniques and algorithms to data structured in the form of a graph. This includes the use of algorithms to extract insights, patterns, and information from relationships between entities represented in a graph.
Algorithms and Techniques in Graph Data Science
Here are some common algorithms and techniques used in Graph Data Science:
PageRank
Community Detection
Link Prediction
Advantages of Graph Data Science
Advantages
- Ability to Handle Complex Data: Graph Data Science is very effective in handling data with many relationships and interactions, which is difficult to analyze with traditional methods.
- Deeper Insights: By leveraging the graph structure, Graph Data Science can provide deeper insights into patterns and relationships present in the data.
- Flexibility: Graph Data Science allows for customization and development of algorithms that can be tailored to specific data analysis needs.
Graph Visualization
Graph data visualization is the process of presenting data structured in the form of a graph visually, which is very important in Graph Analytics for several reasons: